0%
From USPS contract documents to operational clarity.
Convert USPS Statements of Work into bid-ready maps, route diagrams, 24-hour timelines, simulations, and contract intelligence.
What you get
Four deliverables that turn a dense SOW into a complete operating picture.
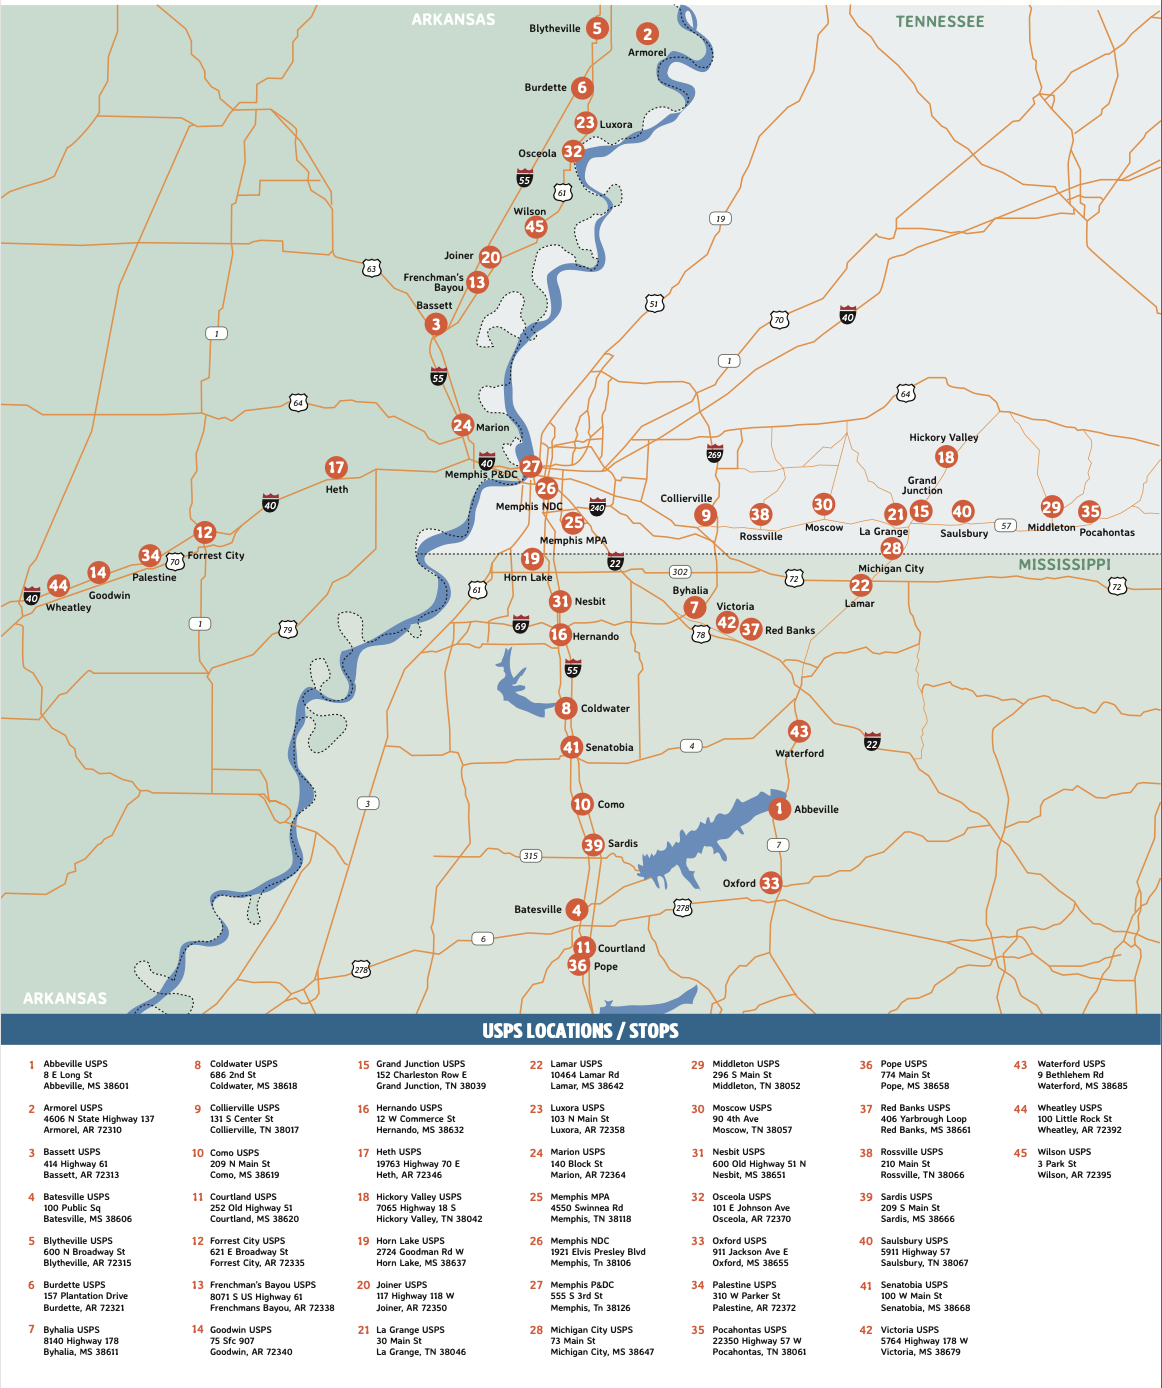
Visual Map
Geospatial view of every location, facility, and stop across the contract territory.
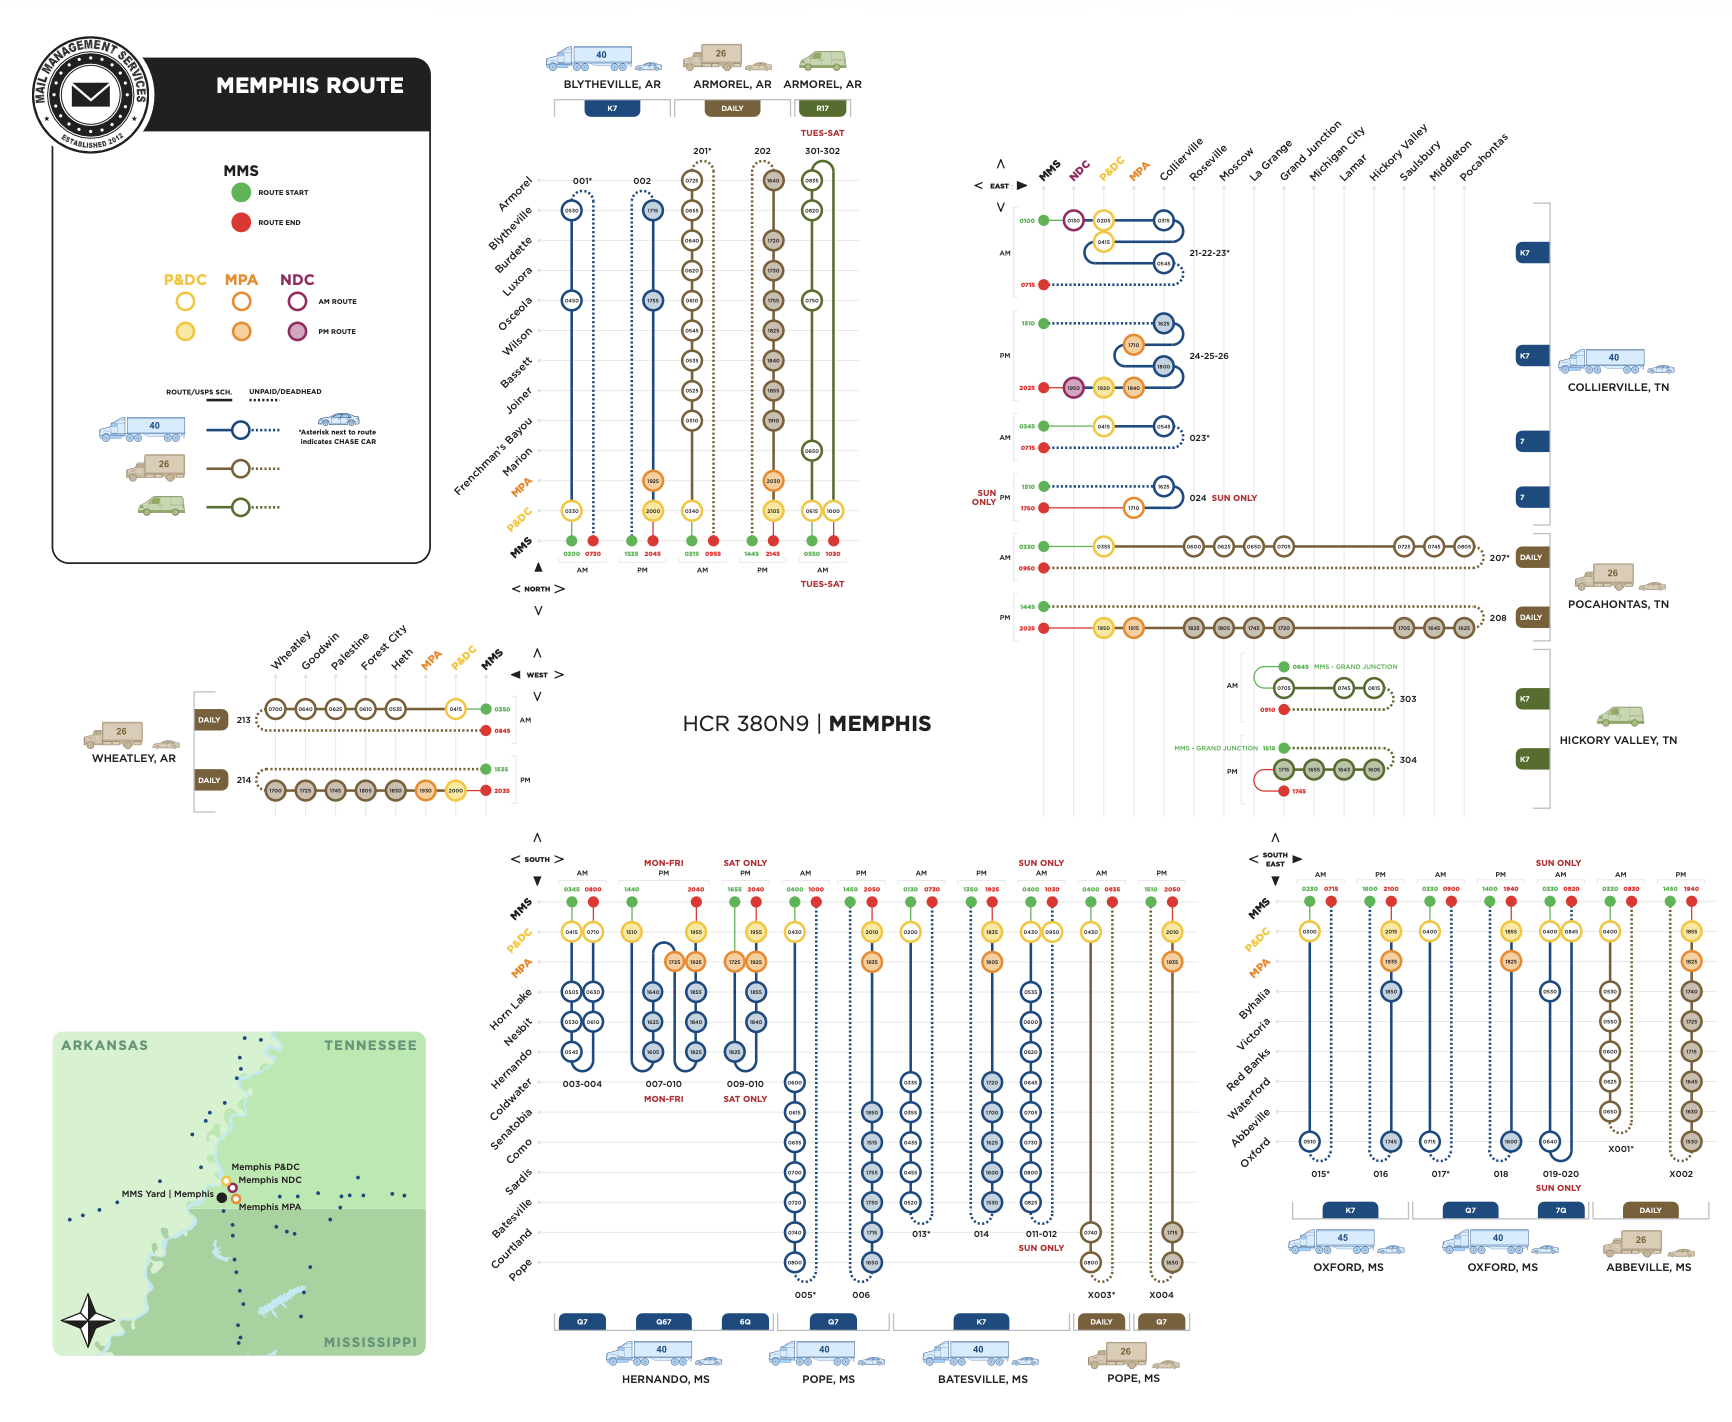
Operational Map
Route logic, directionality, stop sequencing, and equipment assignment as a systems diagram.
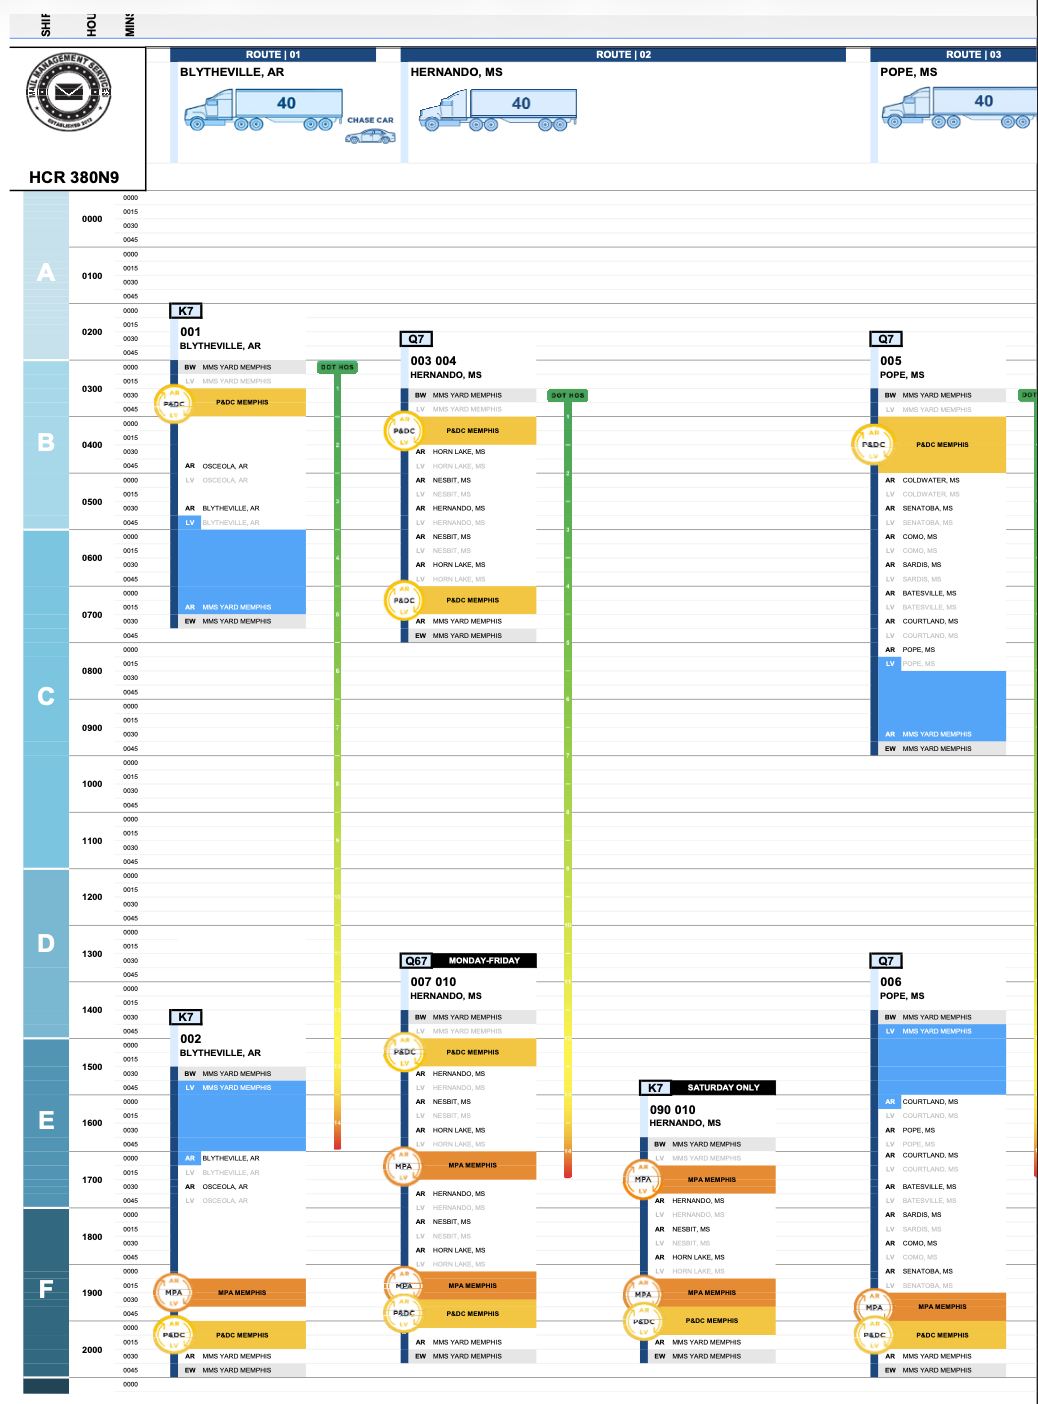
24-Hour Timeline
Full-day service choreography showing route overlap, idle windows, and handoff timing.
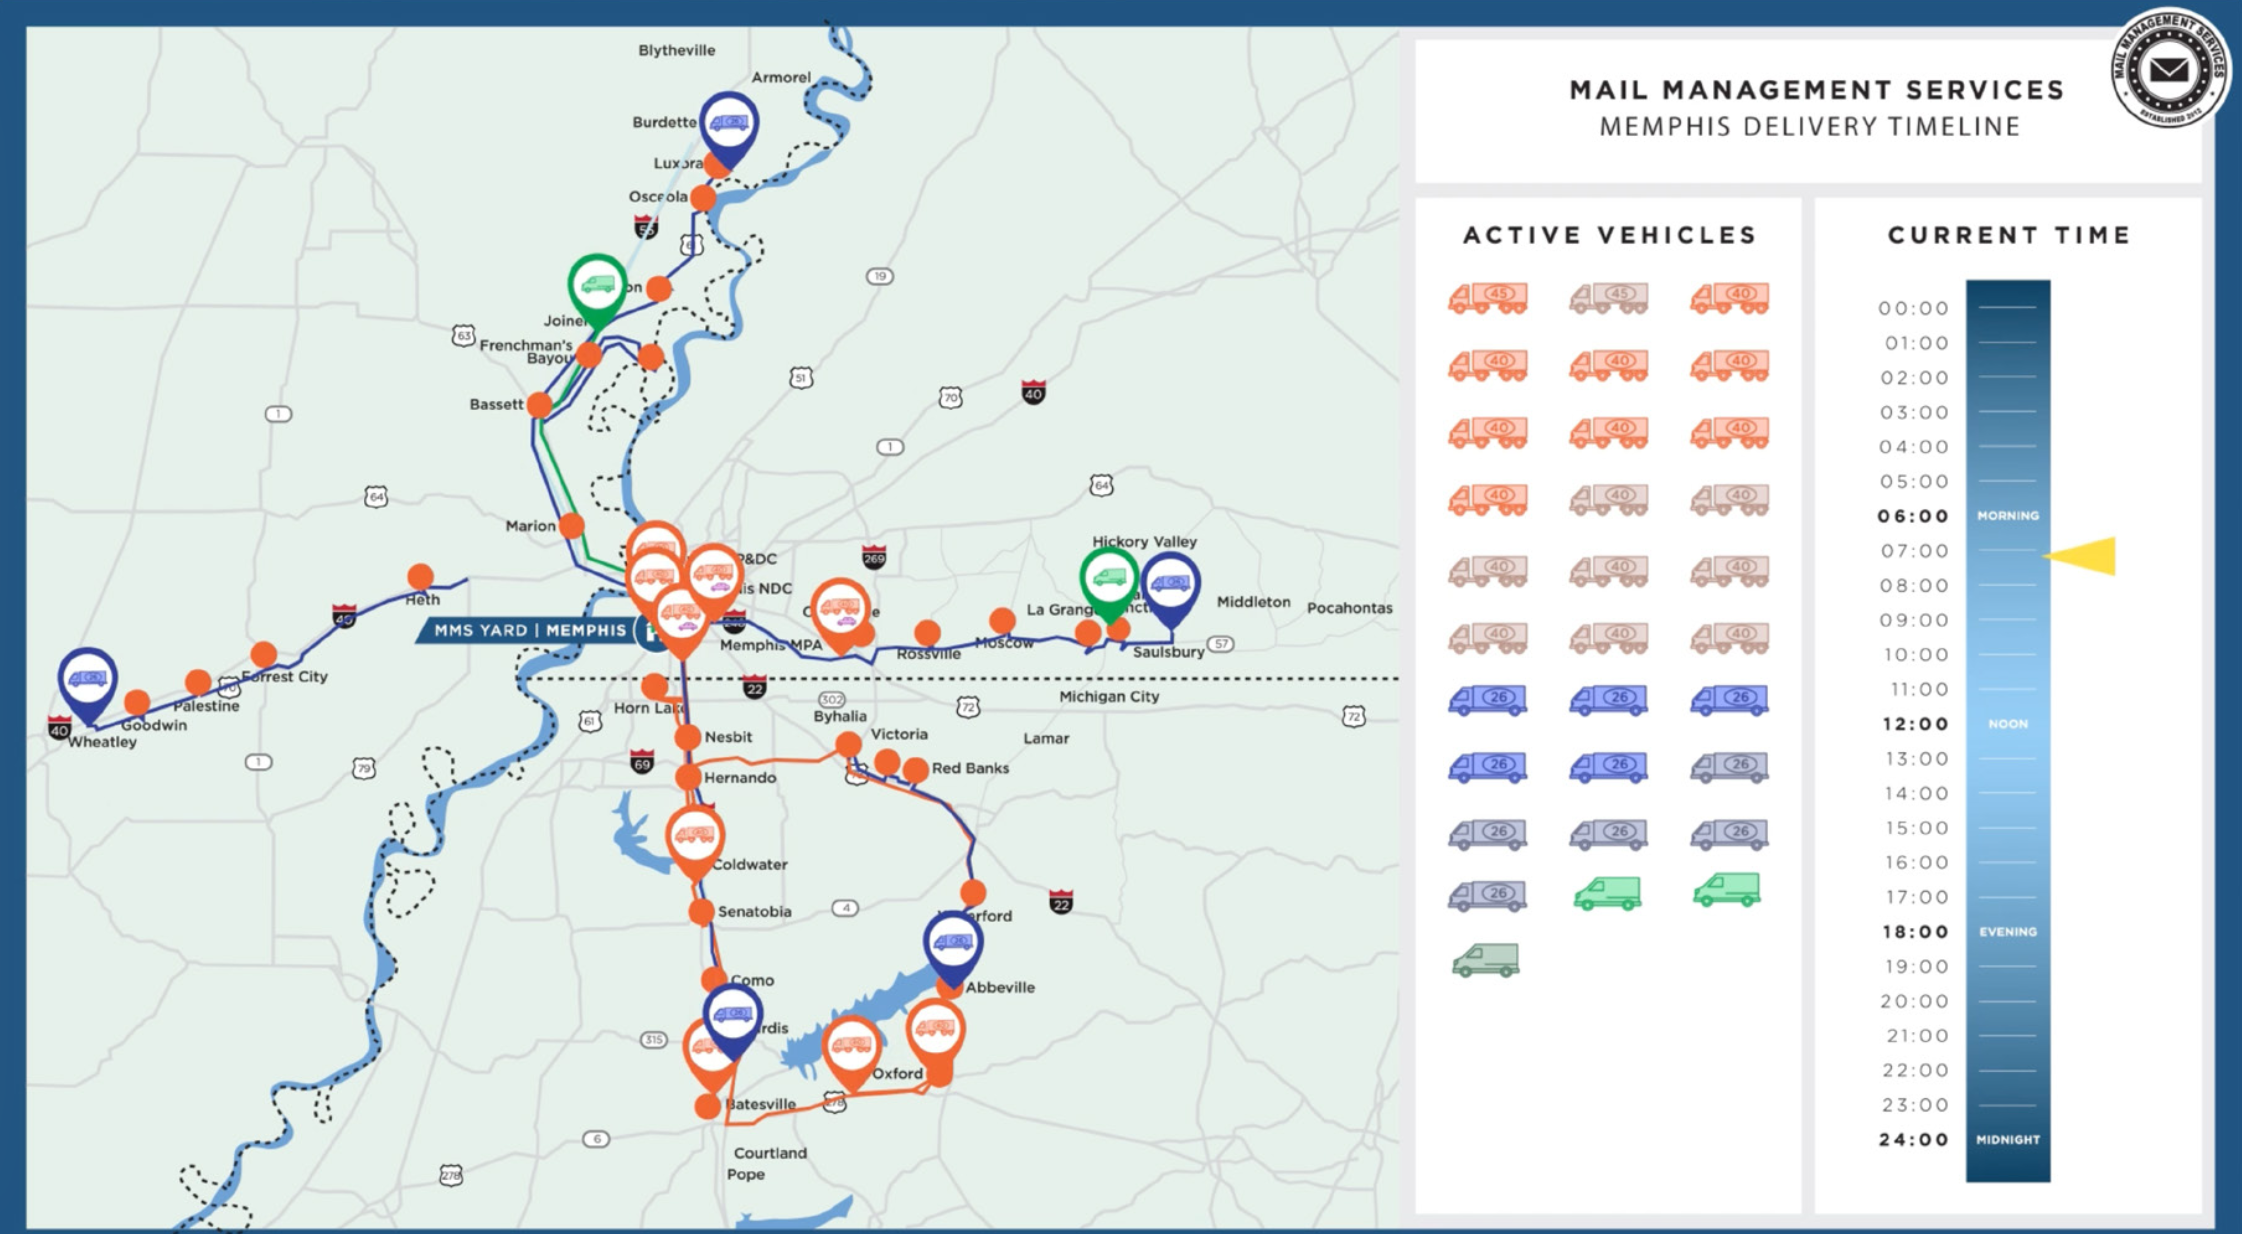
Simulation Video
Animated playback of the entire operating day with active routes, vehicles, and system state.
How it works
Six steps from raw SOW document to complete visual operating picture.
Scan the USPS SOW
Ingest the Statement of Work and extract route, facility, schedule, and equipment data.
Build one-page analysis
Generate a contract evaluation covering Plan A/B hours, miles, travel expenses, and cost analysis.
Generate visual map
Plot all service points, facilities, and stops across the contract territory on a clean geographic view.
Generate operational map
Define route logic by cardinal orientation, stop sequencing, facility handoffs, and equipment assignment.
Build 24-hour timeline
Align all routes into a full-day dispatch schedule showing overlap, idle time, and handoff windows.
Create simulation video
Animate the operating day with all routes running simultaneously for complete operational visibility.
Not just visualization.
Contract intelligence.
Surface the data that matters at portfolio scale: program mix, supplier concentration, contract value, rebid timing, and risk indicators.
Why it matters
Understand requirements faster
Replace days of manual SOW interpretation with a clear visual breakdown of every route, schedule, and equipment requirement.
Prepare more informed bids
See the full operational picture before you price. Maps, timelines, and simulations reveal what the text alone cannot.
Reduce ambiguity and back-and-forth
Visual deliverables surface gaps and conflicts early, cutting clarification cycles with the USPS.
Mail Management Services
Built from real USPS transportation operations.
Not hypothetical software workflows. DataVisual is built by a dedicated USPS contractor operating across 14 states with 46 HCR/LRO contracts, 99.9% on-time performance, and more than 300,000 scheduled annual trips.
See your contract, visually.
Find out what DataVisual reveals about your next USPS bid.